CloudWatch Metrics? No, thank you. Timestream (feat CloudFormation)!
10 November 2023
Ok, Hashi, that's it. I'm giving up Terraform. And even OpenTofu doesn't taste now. Amazon convinced me. CloudFormation is the leader of Infrastructure as Code. But today, I'll break even more rules. CloudWatch Metrics? Nah, let's put our CPU and Memory usage into Timestream. Because why not? Having a graph of your filesystem usage updated every second is not enough. We need real-time.
Find the repository here: https://github.com/ppabis/ec2-metrics-timestream
What is Timestream
So similar to CloudWatch Metrics but on a much more enormous scale, Timestream is a database that collects values over time. It's a managed service, so no need to create instances. It can process millions of requests from thousands of sources. It can aggregate the results and smooth out the graphs. It can also export to S3, so that you can use it later for any ETL processes, analytics or ML.
Creating a Timestream database
Let's start with Timestream structure. Databases - the top level objects - contain tables - similar to MySQL. However, the data tables hold is not rows and columns but measures. The measures have their required value and name. They can also contain multiple dimensions. Compare it to Prometheus, where you have multiple metrics with their names, values and labels (dimensions).
In this project, we would like to collect system metrics of our EC2 instances, namely CPU utilization (per each core), memory (cached, buffered, free, used), and root filesystem (bytes used, bytes free, percent used). It would be possible to put everything into a single table but for each component we will use a different table.
Let's start with a simple template with a single database that can be named however we want using a parameter.
---
AWSTemplateFormatVersion: 2010-09-09
Description: Timestream database for system metrics

Parameters:
  DatabaseName:
    Type: String
    Description: Name of the Timestream database
    Default: MyEc2SystemMetrics

Resources:
  TimestreamDatabase:
    Type: AWS::Timestream::Database
    Properties:
      DatabaseName: !Ref DatabaseName
      Tags:
        - Key: Name
          Value: !Ref DatabaseName
Put the contents into timestream.yaml. Deploy it using AWS CLI.
$ aws cloudformation create-stack --stack-name MyTimestreamMetrics --template-body file://timestream.yaml
$ aws cloudformation describe-stacks
{
  "Stacks": [
    {
      "StackName": "MyTimestreamMetrics",
      "Description": "Timestream database for system metrics",
      "Parameters": [
        {
          "ParameterKey": "DatabaseName",
          "ParameterValue": "MyEc2SystemMetrics"
        }
      ],
      "CreationTime": "2023-11-06T20:53:58.134000+00:00",
      "StackStatus": "CREATE_COMPLETE",
      ...
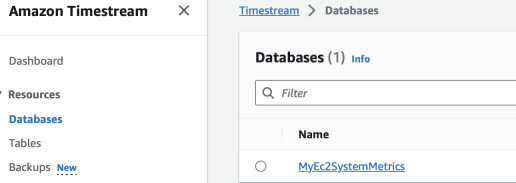
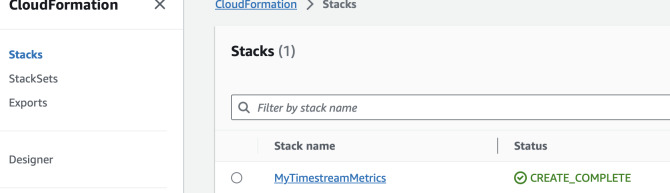
We can also view it in the console by choosing specific region and going to either Timestream or CloudFormation.
Next we can create Timestream tables. Append to the previous YAML file the following resources and update the stack.
...
Resources:
...
  CpuTable:
    Type: AWS::Timestream::Table
    Properties:
      DatabaseName: !Ref TimestreamDatabase
      TableName: CpuUtilization
      RetentionProperties:
        MemoryStoreRetentionPeriodInHours: 36
        MagneticStoreRetentionPeriodInDays: 2
      Tags:
        - Key: Name
          Value: CpuUtilization

  MemoryTable:
    Type: AWS::Timestream::Table
    Properties:
      DatabaseName: !Ref TimestreamDatabase
      TableName: MemoryUtilization
      RetentionProperties:
        MemoryStoreRetentionPeriodInHours: 36
        MagneticStoreRetentionPeriodInDays: 2
      Tags:
        - Key: Name
          Value: MemoryUtilization

  FilesystemTable:
    Type: AWS::Timestream::Table
    Properties:
      DatabaseName: !Ref TimestreamDatabase
      TableName: DiskUsed
      RetentionProperties:
        MemoryStoreRetentionPeriodInHours: 36
        MagneticStoreRetentionPeriodInDays: 2
      Tags:
        - Key: Name
          Value: DiskUsed
Update the stack by uploading the template again.
IAM role with permissions
Now we would like to create a role in IAM that will be able to write to all the tables in Timestream database. We will use it later in our EC2 instances. Our CloudFormation template is growing so maybe we should split it. In that case, in the current template we would need to export at least the database name or ARN to be able to use it in the other template and specify which resource to allow the principal write to.
In the current CloudFormation template add a new section Outputs where we will
create an exported value for the database ARN.
...
Resources:
...
Outputs:
  Ec2MetricsTimestreamDBArn:
    Description: ARN of the Timestream database for EC2 system metrics
    Value: !GetAtt TimestreamDatabase.Arn
    Export:
      Name: !Sub "Ec2MetricsTimestreamDBArn"
We will now reference it in the new template by name from the Export section.
A new stack will contain the policy, role and instance profile. The policy will
also restrict the access to the specific database (all tables). It would be nice
if we could require the instance to add appropriate dimensions to the metrics
based on instance ID, however as of today it's not possible - there are no
condition keys in
IAM for WriteRecords
Timestream action.
---
AWSTemplateFormatVersion: 2010-09-09
Description: IAM setup for EC2 instances that will report metrics to Timestream

Parameters:
  RoleName:
    Type: String
    Description: Name of the role that will be created
    Default: MeteredEC2Role

  PolicyName:
    Type: String
    Description: Name of the policy that will be created
    Default: MeteredEC2TimestreamPolicy

Resources:
  EC2Role:
    Type: AWS::IAM::Role
    Properties:
      RoleName: !Ref RoleName
      AssumeRolePolicyDocument:
        Version: 2012-10-17
        Statement:
          - Effect: Allow
            Principal:
              Service: ec2.amazonaws.com
            Action: sts:AssumeRole

  ManagedEC2Policy:
    Type: AWS::IAM::ManagedPolicy
    Properties:
      # Attach this policy to EC2 Role on create
      Roles:
        - !Ref EC2Role
      ManagedPolicyName: !Ref PolicyName
      PolicyDocument:
        Version: 2012-10-17
        Statement:
          - Effect: Allow
            Action:
              - timestream:WriteRecords
            # Creates a wildcard table resource for the Timestream database
            Resource: !Join ["/", [!ImportValue Ec2MetricsTimestreamDBArn, "table", "*"]]
          - Effect: Allow
            Action:
              - timestream:DescribeEndpoints
            Resource: "*"

  EC2Profile:
    Type: AWS::IAM::InstanceProfile
    Properties:
      Path: /
      Roles:
        - !Ref EC2Role

Outputs:
  ProfileArn:
    Description: Name of the instance profile
    Value: !Ref EC2Profile
    Export:
      Name: "MeteredEC2Profile"
Apply it with IAM capabilities to a new stack.
$ aws cloudformation create-stack\
 --stack-name MyTimestreamEC2Role\
 --template-body file://ec2-timestream-iam.yaml\
 --region eu-west-1\
 --capabilities CAPABILITY_NAMED_IAM
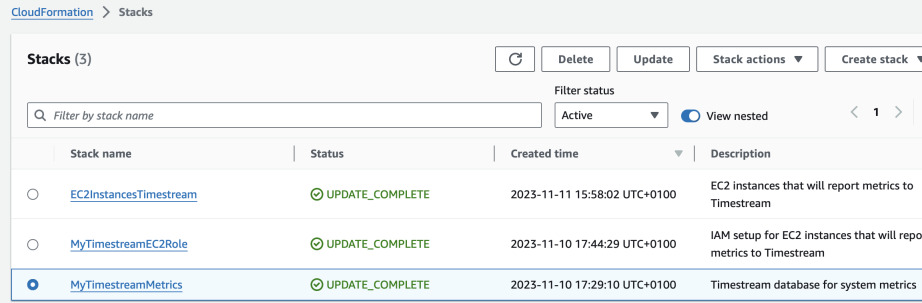
You can watch if the stacks are created in the AWS Console or using the following CLI command.
$ aws cloudformation describe-stacks\
 --region eu-west-1\
 --query 'Stacks[].[StackName, StackStatus]'
Script to send metrics to Timestream
Now we will create a small script that will be frequently reporting data to the Timestream table. It needs to be a daemon because cron runs at most every one minute. We will use standard AWS SDK which is Boto3 and Python. For even more performance I would even recommend going with Go but it would take too much time for the demo.
import boto3, os, time, requests

"""
This script runs in a loop, collects CPU, Memory and root filesystem metrics and
sends it to Timestream.
"""

def get_cpu() -> list[float]:
    """
    Get average CPU utilization per core
    Based on: https://www.idnt.net/en-US/kb/941772
    """
    with open('/proc/stat') as f:
        lines = f.readlines()
    # Leave only each CPU core
    lines = [line.rstrip() for line in lines if line.startswith('cpu') and not line.startswith('cpu ')]
    # Split each line into values
    values = [line.split() for line in lines]
    # Convert to int
    values = [[int(v) for v in value[1:]] for value in values]
    # Get second measurement
    time.sleep(0.1)
    with open('/proc/stat') as f:
        lines = f.readlines()
    # Leave only each CPU core
    lines = [line.rstrip() for line in lines if line.startswith('cpu') and not line.startswith('cpu ')]
    values2 = [line.split() for line in lines]
    values2 = [[int(v) for v in value[1:]] for value in values2]

    total_deltas = [(sum(values2[i]) - sum(values[i])) for i in range(len(values))]
    total_idle = [(values2[i][3] - values[i][3]) for i in range(len(values))]
    total_used = [(total_deltas[i] - total_idle[i]) for i in range(len(values))]
    total_usage = [(total_used[i] / total_deltas[i]) * 100 for i in range(len(values))]
    return total_usage

def get_memory() -> (float, float, float):
    """
    Get memory utilization: (buffered, free, used) as % of total memory
    """
    # Returns something like:
    #               total        used        free      shared  buff/cache   available
    #Mem:             427         138          84           0         204         279
    #Swap:            426           0         426
    #Total:           854         138         511
    mem = os.popen("free -t -m").readlines()[1]
    values = mem.split()
    total = float(values[1])
    used_pct = float(values[2]) / total * 100
    free_pct = float(values[3]) / total * 100
    buffer_pct = float(values[5]) / total * 100

    return (buffer_pct, free_pct, used_pct)

def get_disk() -> (float, float):
    """
    Get disk utilization: (used, free) as % of total disk space
    """
    # Returns something like:
    # Filesystem     1K-blocks    Used Available Use% Mounted on
    # /dev/nvme0n1p1   8311788 1770492   6541296  22% /
    disk = os.popen("df /").readlines()[1]
    values = disk.split()
    total = float(values[1])
    used_pct = float(values[2]) / total * 100
    free_pct = float(values[3]) / total * 100

    return (used_pct, free_pct)

def main():
    database_name = os.environ['TS_DATABASE']
    # Ask IMDSv2 for Instance ID
    token = requests.put('http://169.254.169.254/latest/api/token', headers={'X-aws-ec2-metadata-token-ttl-seconds': '60'}).text
    instance_id = requests.get('http://169.254.169.254/latest/meta-data/instance-id', headers={'X-aws-ec2-metadata-token': token}).text
    region = requests.get('http://169.254.169.254/latest/meta-data/placement/region', headers={'X-aws-ec2-metadata-token': token}).text

    dimensions = [ {'Name': 'InstanceId', 'Value': instance_id} ]

    ts = boto3.client('timestream-write', region_name=region)
    while True:
        cpu = get_cpu()
        memory = get_memory()
        disk = get_disk()

        cpu_records = [
            {
                'Dimensions': dimensions + [{'Name': 'Core', 'Value': str(i)}],
                'MeasureName': 'cpu_utilization',
                'MeasureValue': str(cpu[i]),
                'MeasureValueType': 'DOUBLE',
                'Time': str(int(time.time() * 1000)),
                'TimeUnit': 'MILLISECONDS',
            } for i in range(len(cpu))
        ]

        memory_records = [
            {
                'Dimensions': dimensions,
                'MeasureName': 'memory_buffered',
                'MeasureValue': str(memory[0]),
                'MeasureValueType': 'DOUBLE',
                'Time': str(int(time.time() * 1000)),
                'TimeUnit': 'MILLISECONDS',
            },
            {
                'Dimensions': dimensions,
                'MeasureName': 'memory_free',
                'MeasureValue': str(memory[1]),
                'MeasureValueType': 'DOUBLE',
                'Time': str(int(time.time() * 1000)),
                'TimeUnit': 'MILLISECONDS',
            },
            {
                'Dimensions': dimensions,
                'MeasureName': 'memory_used',
                'MeasureValue': str(memory[2]),
                'MeasureValueType': 'DOUBLE',
                'Time': str(int(time.time() * 1000)),
                'TimeUnit': 'MILLISECONDS',
            }
        ]

        disk_records = [
            {
                'Dimensions': dimensions,
                'MeasureName': 'disk_used',
                'MeasureValue': str(disk[0]),
                'MeasureValueType': 'DOUBLE',
                'Time': str(int(time.time() * 1000)),
                'TimeUnit': 'MILLISECONDS',
            },
            {
                'Dimensions': dimensions,
                'MeasureName': 'disk_free',
                'MeasureValue': str(disk[1]),
                'MeasureValueType': 'DOUBLE',
                'Time': str(int(time.time() * 1000)),
                'TimeUnit': 'MILLISECONDS',
            }
        ]

        ts.write_records(DatabaseName=database_name, TableName='CpuUtilization', Records=cpu_records)
        ts.write_records(DatabaseName=database_name, TableName='MemoryUtilization', Records=memory_records)
        ts.write_records(DatabaseName=database_name, TableName='DiskUsed', Records=disk_records)
        time.sleep(0.2)


if __name__ == '__main__':
    main()
Creating Instances
Use the template below to create new instances that can be used for testing.
This setup is written for eu-west-1 with EC2 Instance Connect. Adapt the
security group CIDR to your liking. Also remember to update the AMI IDs SSM
versions if you need newer version (current latest is 57). You will also need to
supply your default VPC ID. Go to the region where you will be creating the
instance and copy the default VPC ID from the VPCs section. Apply like this:
$ aws cloudformation create-stack\
 --region eu-west-1\
 --stack-name EC2InstancesTimestream\
 --template-body file://ec2-instances.yaml\
 --parameters ParameterKey=VPC,ParameterValue=vpc-090909098a8a
The template looks like the following. It also copies the instance profile name from the previous stack.
---
AWSTemplateFormatVersion: 2010-09-09
Description: EC2 instances that will report metrics to Timestream

Parameters:
  ArmAmi:
    Type: String
    Description: AL2023 AMI ID for ARM-based EC2 instances
    Default: "{{resolve:ssm:/aws/service/ami-amazon-linux-latest/al2023-ami-kernel-6.1-arm64:57}}"
  AmdAmi:
    Type: String
    Description: AL2023 AMI ID for AMD64-based EC2 instances
    Default: "{{resolve:ssm:/aws/service/ami-amazon-linux-latest/al2023-ami-kernel-6.1-x86_64:57}}"
  VPC:
    Type: AWS::EC2::VPC::Id
    Description: VPC ID for the EC2 instances

Resources:
  SSHSecurityGroup:
    Type: AWS::EC2::SecurityGroup
    Properties:
      VpcId: !Ref VPC
      GroupName: SSHSecurityGroup
      GroupDescription: Allow SSH access from EC2 Instance Connect
      SecurityGroupIngress:
        - IpProtocol: tcp
          FromPort: 22
          ToPort: 22
          # EC2 Instance Connect IP range for eu-west-1
          CidrIp: 18.202.216.48/29

  Instance1:
    Type: AWS::EC2::Instance
    Properties:
      InstanceType: t3a.micro
      ImageId: !Ref AmdAmi
      NetworkInterfaces:
        - DeviceIndex: 0
          GroupSet:
            - !Ref SSHSecurityGroup
          AssociatePublicIpAddress: true
      IamInstanceProfile: !ImportValue MeteredEC2Profile
      Tags:
        - Key: Name
          Value: Instance1

  Instance2:
    Type: AWS::EC2::Instance
    Properties:
      InstanceType: t4g.small
      ImageId: !Ref ArmAmi
      NetworkInterfaces:
        - DeviceIndex: 0
          GroupSet:
            - !Ref SSHSecurityGroup
          AssociatePublicIpAddress: true
      IamInstanceProfile: !ImportValue MeteredEC2Profile
      Tags:
        - Key: Name
          Value: Instance2
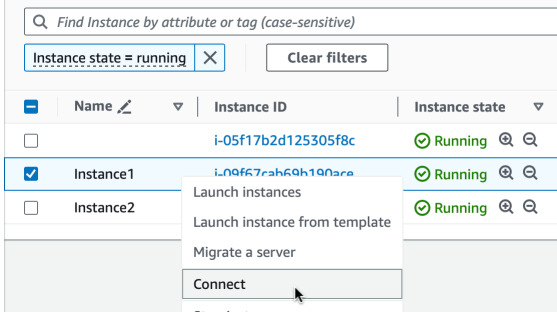
To transfer the script to the instance you can use S3 bucket, some other HTTP
endpoint or just use cat in the console. Select all the Python code, copy it,
go to the EC2 Instance Connect window and do it like this:
$ cat > measure.py <<EOF
here you click paste and press enter/return
EOF
To run it in a deamon mode, we will use nohup and & to run it in Bash. Also
install Pip, Boto3 and requests. Also specify the database name in environment
variables.
$ sudo yum install -y python3-pip
$ sudo pip3 install boto3 requests
$ export TS_DATABASE=MyEc2SystemMetrics
$ nohup python3 measure.py &
# Press enter.
If you got a prompt without any message such as
[1]+ Exit 1 nohup python3 measure.py that means that the script is running.
Verify by typing ps aux | grep python3 and you should see the process running.
For troubleshooting type cat nohup.out. Now you can do some heavy work on the
instance.
$ for i in {1..1000}; do (echo $i | sha1sum 2>&1 1>/dev/null); done
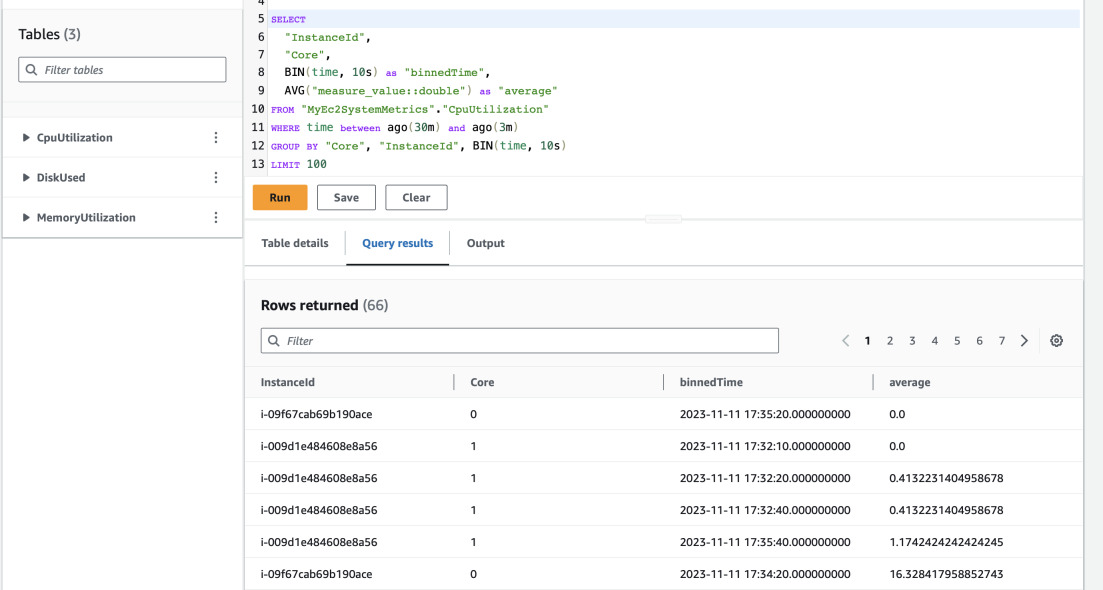
And after a while you can check the results in Timestream. Open Timestream in AWS Console and head to Query Editor. You can use the following query to get some averages for some time of CPU utilization. It will be binned every 10 seconds. You should get results similar to those below.
SELECT
  "InstanceId",
  "Core",
  BIN(time, 10s) as "binnedTime",
  AVG("measure_value::double") as "average"
FROM "MyEc2SystemMetrics"."CpuUtilization"
WHERE time between ago(30m) and now()
GROUP BY "Core", "InstanceId", BIN(time, 10s)
LIMIT 100
It would be better to see some graphs. This can be done with QuickSight or Grafana but it's a topic for another post.