Track you Google Play metrics with Grafana - Part 2
22 August 2023
Previously we have created a Python script that pulls data from Google Play
Developer Console. The repository contained a main function that used Prometheus
client to expose the metrics under /metrics endpoint. Today, I will explain it
and we will further develop the project by putting it inside a container and
composing a stack with Prometheus server and Grafana.
The complete code can be found on GitHub.
Main function
The two functionalities of the script: Installs/Uninstalls and Vitals were put
into separate files and classes: InstallReports and ErrorCounts
respectively. They are configurable to query multiple apps easily and adding a
delay to the query, so that if one of the reports is lagging, we can get a
common row.
The common row is constructed using pandas library. DataFrame contains a
merge function - using inner join over Date field, we can get an
intersection of the two reports. The last row is the freshest one for the two.
It can happen that error counts is empty because there were no crashes reported.
In this case, we will create an empty data frame with the same range as the
install reports.
for app in APPS:
    print(f"App: {app}")
    reports = installReports.get_statistics(app)
    counts = errorCounts.query(app)
    if len(counts) == 0:
      print("No error counts")
      # Create copy of reports dates with all distinctUsers values set to 0
      counts = DataFrame([(r, 0.0) for r in reports["Date"]], columns=["Date", "distinctUsers"])
    # Merge the two dataframes
    merged = reports.merge(counts, on="Date", how="inner")
    print(merged)

    # Select the latest record
    latest = merged.iloc[-1]
    for metric in latest.index:
      if metric != "Date":
        set_counters(app, metric, latest[metric])
At the end we are calling set_counters function that is responsible for
feeding Prometheus Gauges. They are constructed only if they don't exist yet.
Otherwise we report metrics for each column in the DataFrame except for the
Date and we label each point with app name.
counters: dict[str, Gauge] = {}

def set_counters(app, metric, value):
  fix_metric = metric.replace(" ", "_").lower()
  if fix_metric not in counters:
    counters[fix_metric] = Gauge(f"{fix_metric}", f"{metric}", ["app"])
  counters[fix_metric].labels(app).set(value)
The main function runs in a separate thread in order to refresh the values from
time to time. It is recommended to refresh it every hour or less frequently. A
server is being started on port 9300 after calling start_http_server(9300).
By visiting the address http://localhost:9300 we can get the metrics collected
so far.
$ curl localhost:9300
# HELP total_user_installs Total User Installs
# TYPE total_user_installs gauge
total_user_installs{app="com.company.myapp"} 20.0
total_user_installs{app="com.company.myotherapp"} 312.0
# HELP update_events Update events
# TYPE update_events gauge
update_events{app="com.company.myapp"} 15.0
update_events{app="com.company.myotherapp"} 33.0
# HELP uninstall_events Uninstall events
# TYPE uninstall_events gauge
uninstall_events{app="com.company.myapp"} 5.0
uninstall_events{app="com.company.myotherapp"} 8.0
# HELP distinctusers distinctUsers
# TYPE distinctusers gauge
distinctusers{app="com.company.myapp"} 2.0
distinctusers{app="com.company.myotherapp"} 17.0
distinctusers metric in our case is the number of users that experienced at
least one app crash.
Separate threads
We would like to run the script in a separate thread, so that we can refresh the
values with a pause in between runs. We will use threading Python package for
this. The main function will be executed by main_thread every hour.
Using if __name__ == "__main__" block, which serves as the entry point to a
Python application, we will create a thread for the main_thread and start a
server to serve Prometheus metrics. For convenience, let's also unregister all
the built-in collectors, so that we can have a clean slate.
def main_thread():
  while True:
    main()
    print("Sleeping for 1 hour")
    sleep(60 * 60)

if __name__ == "__main__":
  prometheus_client.REGISTRY.unregister(prometheus_client.GC_COLLECTOR)
  prometheus_client.REGISTRY.unregister(prometheus_client.PLATFORM_COLLECTOR)
  prometheus_client.REGISTRY.unregister(prometheus_client.PROCESS_COLLECTOR)
  Thread(target=main_thread).start() # Create thread to fill counters
  start_http_server(9300) # Serve Prometheus metrics via HTTP
Creating a Docker image
Next up we will collect all our files and prepare a Docker image that will help
us in testing with other services, namely Prometheus and Grafana. As a base
image, I suggest using Python on Debian, such as python:3.11-bookworm. Alpine
images are smaller, but installing packages is much more time consuming as many
of them have to be recompiled.
FROM python:3.11-bookworm

COPY requirements.txt /tmp/requirements.txt
RUN pip install -r /tmp/requirements.txt\
 && rm /tmp/requirements.txt

WORKDIR /app
COPY src /app/src/
COPY main.py /app/

ENTRYPOINT [ "/usr/local/bin/python3", "-u" ]
CMD [ "main.py" ]
Docker Compose
Now is the time to start collecting data with out script. Prometheus server is a critical part of it as it is the place to store series based on time. Grafana will let us visualize the data with many advanced features, but you can also make graphs in Prometheus itself already.
We will start all of the services in a common network named play-metrics-net.
By doing this we can easily refer URIs to the services by their names such as
prometheus:9090.
There will be two volumes for storing settings and data: one for Prometheus and one for Grafana.
---
version: '3.3'
# Common network for the containers
networks:
  play-metrics-net:
    driver: bridge

# Store persistently Prometheus and Grafana data
volumes:
  prometheus:
  grafana:

# Define services
services:
  prometheus:
    image: prom/prometheus:latest
    volumes:
      - prometheus:/prometheus # Volume for persisting collected metrics
      - ./prometheus.yml:/etc/prometheus/prometheus.yml # Config, see below
    command:
      - '--config.file=/etc/prometheus/prometheus.yml'
      - '--storage.tsdb.path=/prometheus'  # Put database in the mounted volume
    networks:
      - play-metrics-net
    ports:
      - 9090:9090

  grafana:
    image: grafana/grafana:latest
    volumes:
      - grafana:/var/lib/grafana # Persist Grafana data such as our dashboards
    ports:
      - 3000:3000
    networks:
      - play-metrics-net

  playmetrics:
    image: ppabis/google-play-report:latest
    build: # Build our service from this file
      context: .
      dockerfile: Dockerfile
    ports:
      - 9300:9300
    restart: always
    volumes:
      - ./mykey.json:/app/mykey.json # Mount Google Service Account ket
    networks:
      - play-metrics-net
    depends_on:
      - prometheus # Wait for Prometheus to start
As seen in the code above, we still need to define a prometheus.yml file. It
will contain a single job that will scrape our service every 5 minutes, even
though the data refreshes only once an hour and in practice even less often:
changes are likely to happen every full day. But for debugging you can set the
scrape_interval to something lower, like 20 seconds in order to see if
everything works as expected. During updates of the code, it's better to delete
the image of playmetrics (referred as: ppabis/google-play-report:latest)
with docker image rm ppabis/google-play-report:latest to ensure that Docker
Compose will rebuild it. Also make sure to review the logs with
docker-compose logs.
scrape_configs:
  - job_name: playmetrics
    scrape_interval: 5m
    metrics_path: /
    static_configs:
      - targets:
          - playmetrics:9300 # Referring container by name
    enable_http2: false
Both prometheus.yml and mykey.json files should be placed from where you
run docker-compose up -d.
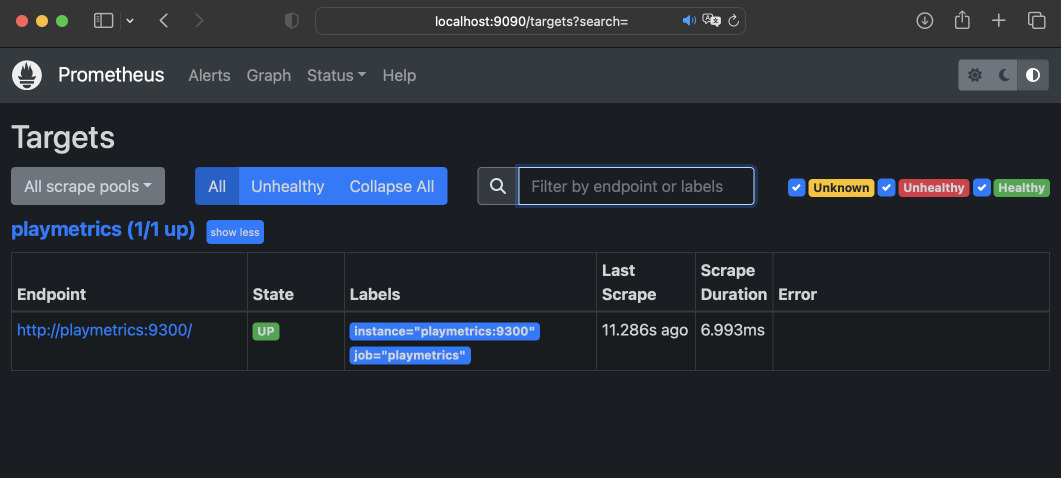
After starting up and verifying that the logs do not produce any Python stack
traces, head to localhost:9090, Status -> Targets and check if the service
is reachable. You might need to wait one scrape_interval.
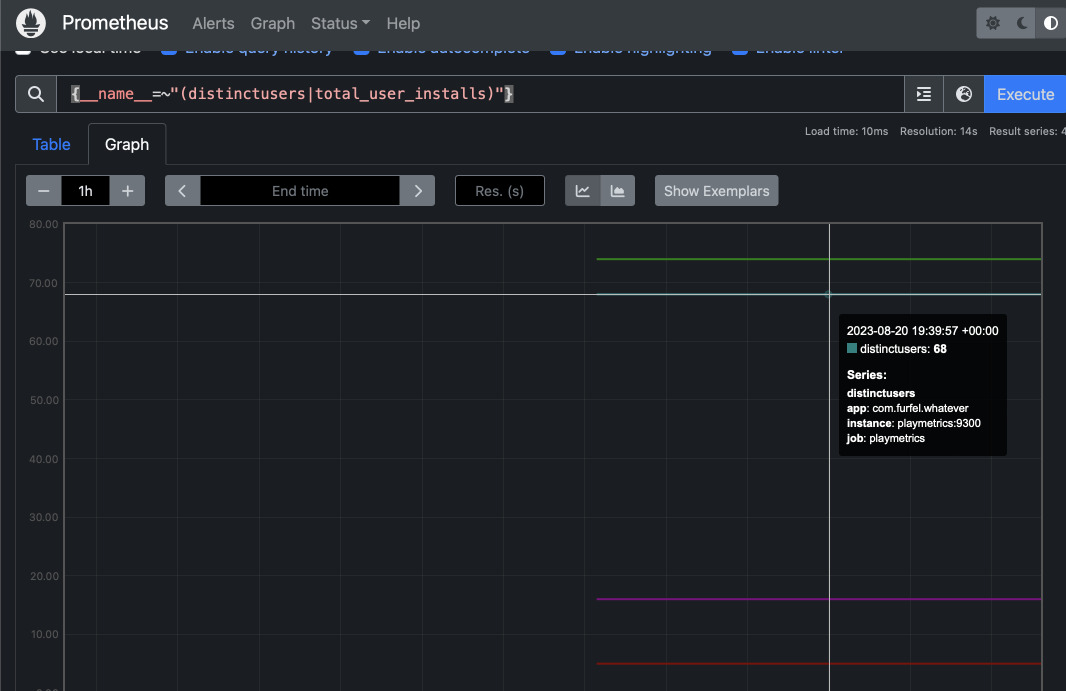
We can also make a small graph of values if it presents anything interesting.
Connecting Prometheus to Grafana
Open Grafana by visiting http://localhost:3000, set a new password (default
credentials are admin/admin). Then click the left menu, go to Connections.
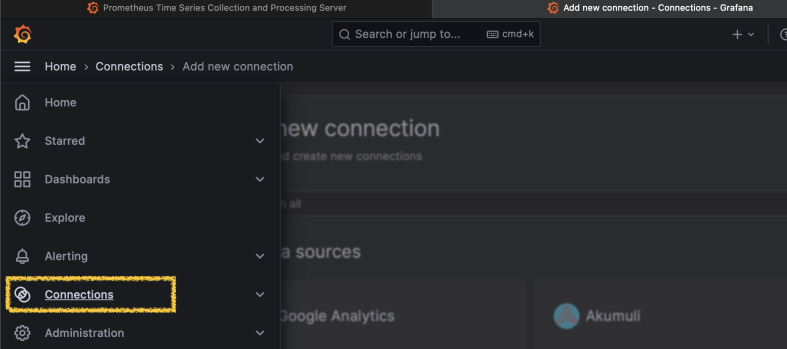
Search for Prometheus, Create data source and as server URL set
http://prometheus:9090. All other settings should be default. Grafana should
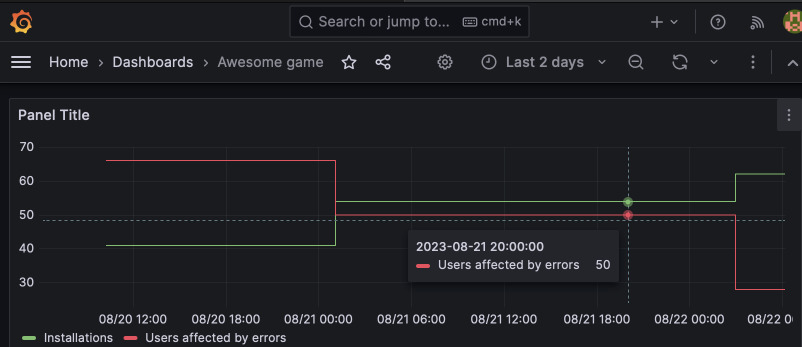
soon query Prometheus for metrics. Create a new dashboard and some graphs. Play
around with Grafana and make some visualizations.
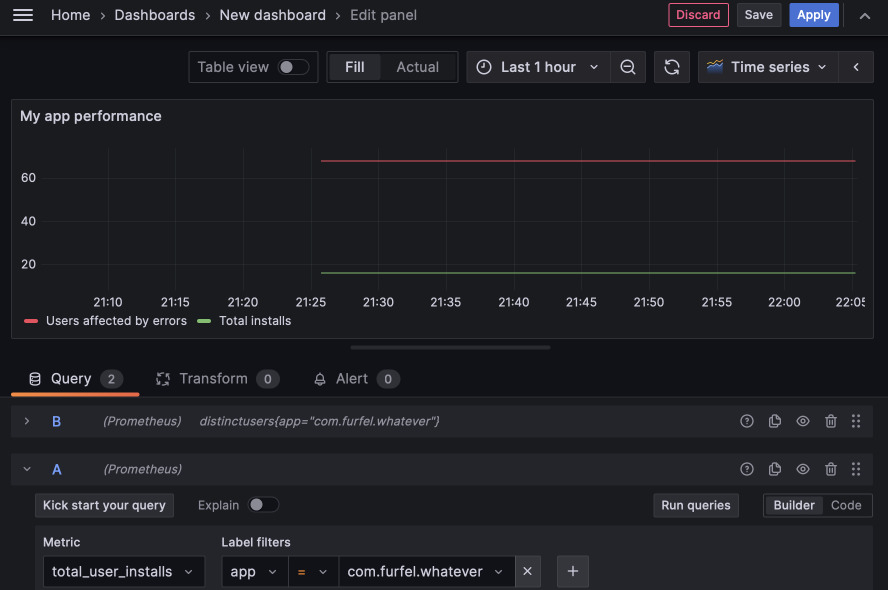
Several days of data collection
After several days of data collection, we should be able to see some movement whether it is up or down.